Azure Monitor- Step-by-Step-Deployment-Part 2
In this post lets see the following,
- How to enable monitoring on non azure VM
- Create computer groups
- Enable Performance counters and windows event logs
- Create an alert when a DB is down from Event viewer logs.
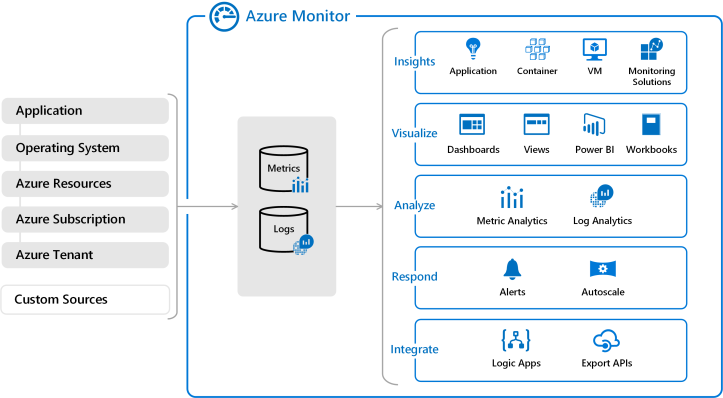
Azure Monitor can collect data directly from physical or virtual Windows computers in your environment into a Log Analytics workspace for detailed analysis and correlation. We can collect data from a datacenter or other cloud environments.
To Download the agents ,Workspace ID & Primary Key

INSTALLING THE AGENT ON NON AZURE VM
Run the downloaded agent on the target VM


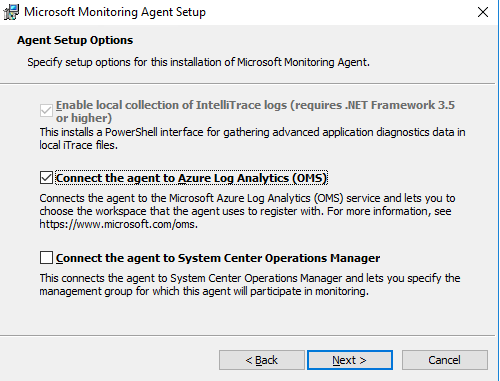


If you have proxy setup, click on advanced and enter the details
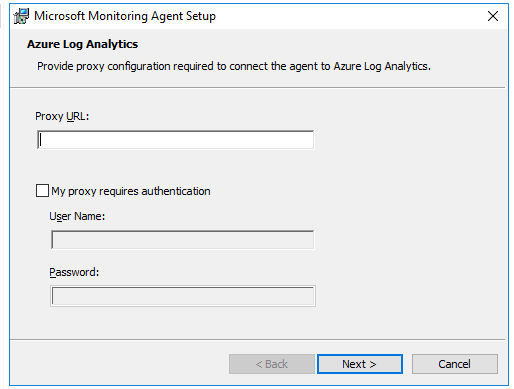
Please note the below URLS should be allowed in firewall and proxy(If you have)
| Destination | Port number |
| *.ods.opinsights.azure.com | 443 |
| *.oms.opinsights.azure.com | 443 |
| *.blob.core.windows.net | 443 |
| *.azure-automation.net | 443 |


Validate the Agent Installation


Check under Agent management page to see if the agent is reporting
ENABLE DATA COLLECTION
By default the data collections will not be enabled, You need to enable the required Event logs, Performance counter, IIS logs etc. Now lets see how to enable the collections,
click on advanced settings Under Data–>Windows event logs
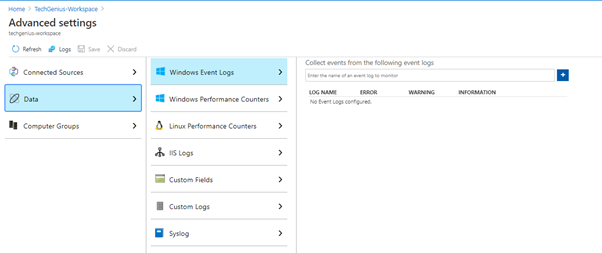
Type the required events logs to capture as below

In this example I have enabled the application logs.

Similarly enable the required performance counter
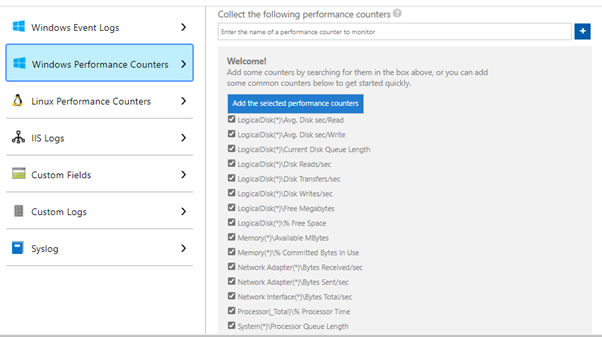
Modify the Sample interval as required. You can select a maximum of 1800 seconds as sample interval.

And remember to save the selected collections.

CREATE COMPUTER GROUP
Saved Groups are groups that are created from a search query. Any query in search that returns a list of computers can be saved as a Saved Group. Go to Search. Enter a query that returns a list of computers. By choosing to save the query, you can enable the toggle to save the query as a computer group. You can view and manage all your Saved Groups in this page.
Sample Query
In this query I have selected the VMS with windows as os family, Remember you need to have distinct computer in the query to be able to save it as computer group
VMComputer | where OperatingSystemFamily contains “Windows” | distinct Computer
Enter the query in logs and click on save.. Select save as function and enable the “save this query as computer group”


ALERT RULE
As we mentioned in the part 1 post, We can configure alerts. This post lets see how to enable alerts for windows evet logs.
Create new alert rule

Configure the signal logic and you can either choose existing or create a custom log search
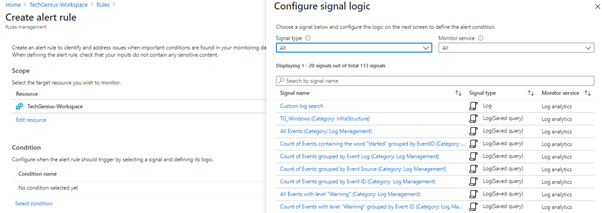

In this search query, Enter the query which needs to be filtered as signal logic
Event | where RenderedDescription has “service entered the stopped state.”


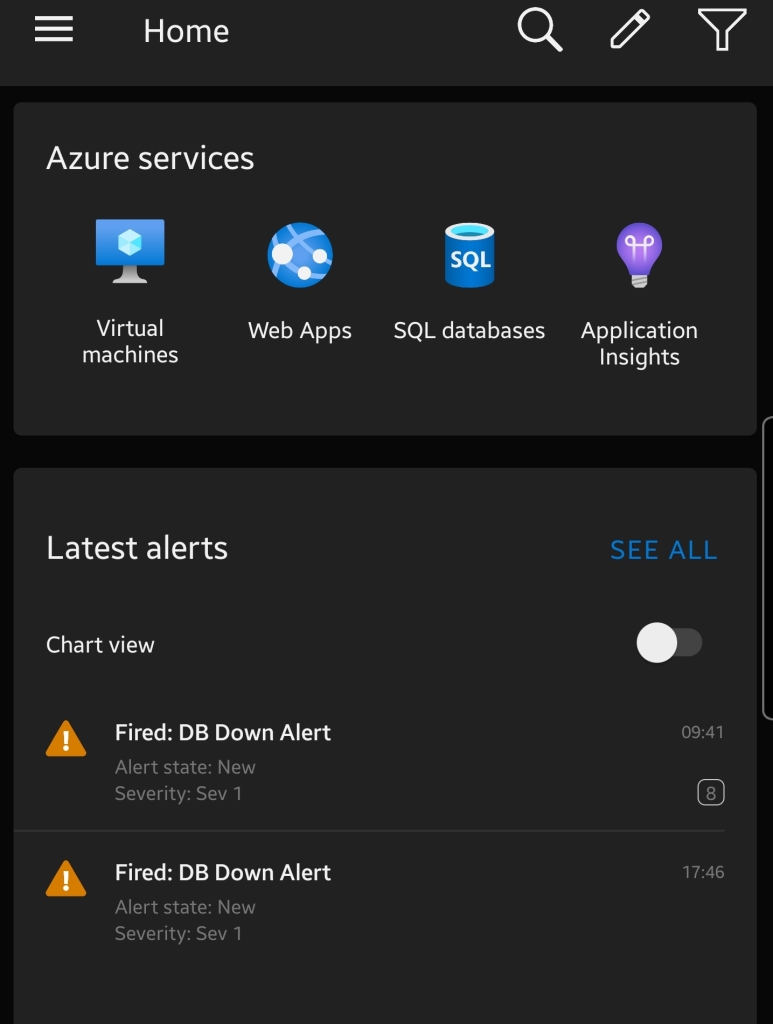
Alert received


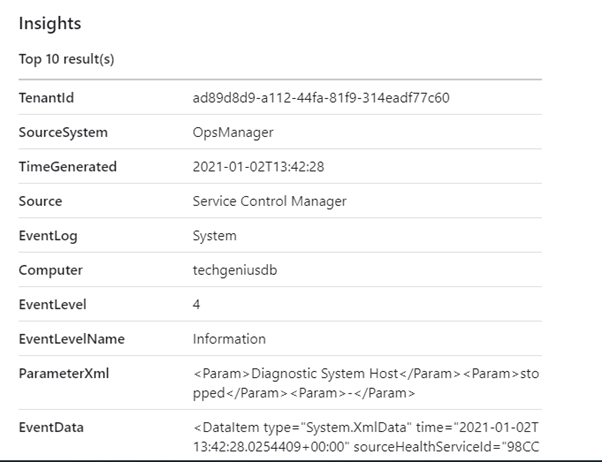
Below is the sample alert received in Azure app and you can also receive as a PUSH notification
Author : Amarnath Rajendran
