
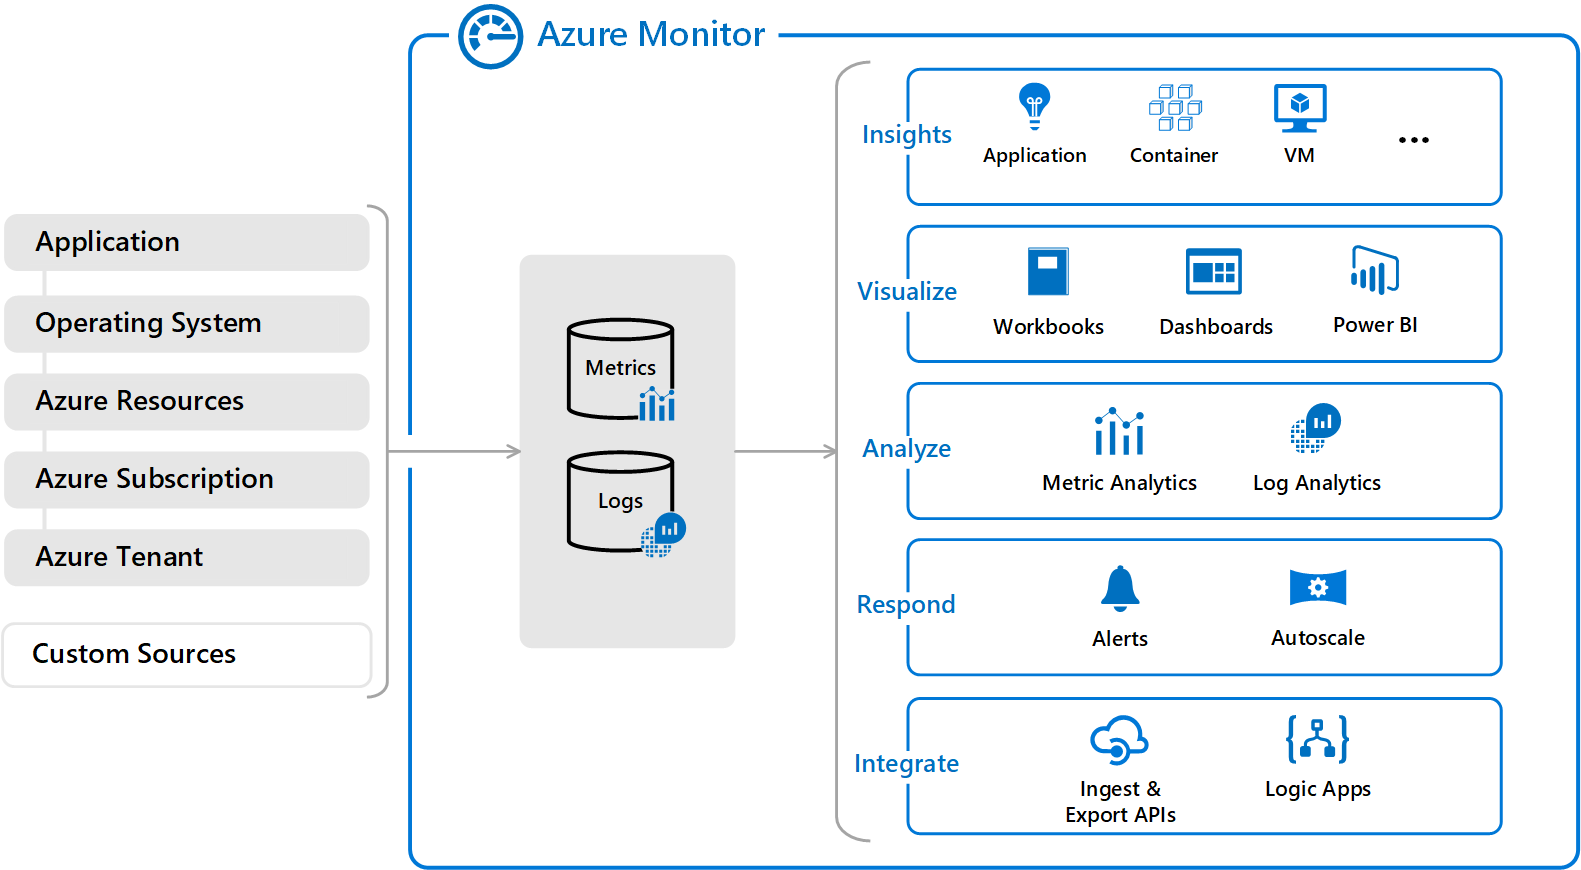
Azure Monitor helps you maximize the availability and performance of your applications and services. It delivers a comprehensive solution for collecting, analyzing, and acting on telemetry from your cloud and on-premises environments. Read this link to know more Azure Monitor overview – Azure Monitor | Microsoft Docs
In this post I will explain the steps involved in configuring azure monitor

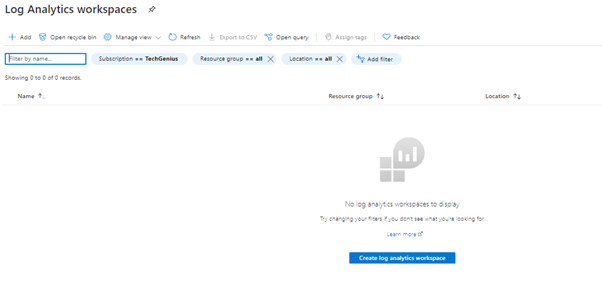
First step is to create log analytics workspace, If you already have one you can choose to use the same.


Once the workspace is created you need to map the workspace configuration in the Azure monitor as below. Select the created workspace and click on enable..
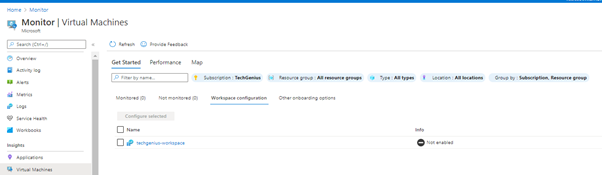

Next lets see how to enable monitoring on windows VM’s hosted in azure
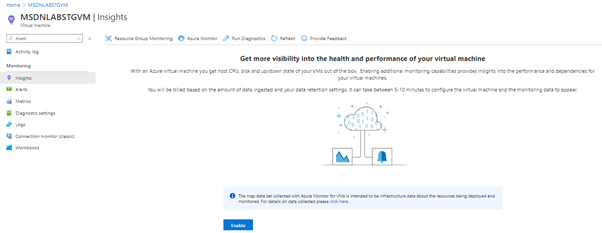
ADD AZURE VM’S INTO MONITORING
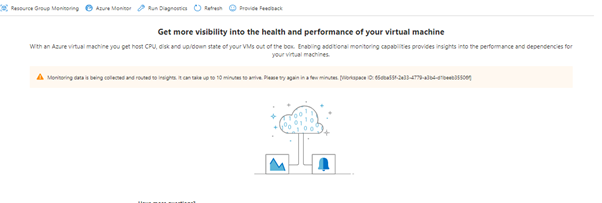
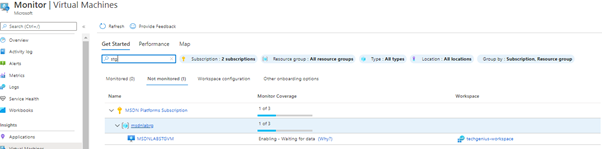
You can either navigate to the desired VM and click on insights or from azure monitor you can select the virtual machines which needs to be monitored

Once enabled you should see a message as below
Validate the virtual Machine

In the newly added machine you should see the MMA and dependency agent installed

CONFIGURING BASIC ALERTS
Navigate to Monitor–>Alerts

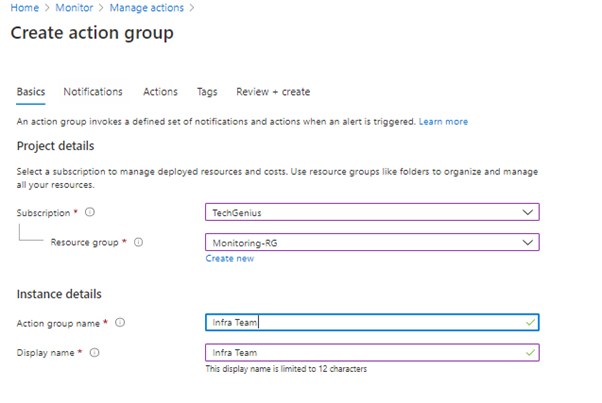
First lets see how to enable a Alert action group to send the notifications when the alert conditions are met.

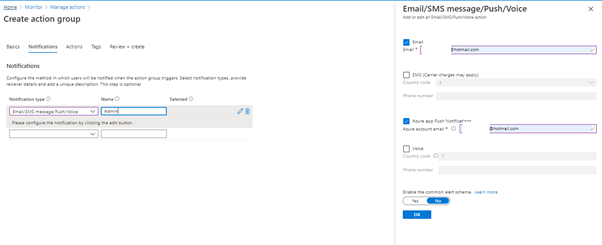


Recipient added in the notification group will receive a confirmation mail

ENABLING ALERTS
Navigate to Monitor–>Alerts

Click on new alert rule, The below window opens
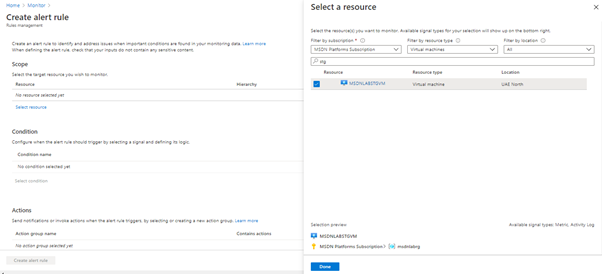
In this you have to select the scope of the alert, you can either choose bulk of resources or selected resources., in this post I will explain about enabling for VMs. So I am adding a single VM in the selections.

Next step is condition, Please choose the condition wisely as per your requirement else you will end up receiving bunch of alerts. So pen down the requirement clearly before you configure.
Depending on the scope selected variety of signals will be listed in the condition section and you can pick the desired ones. In this post I have taken CPU utilization which is most common
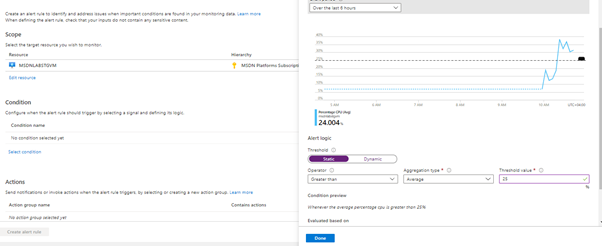
Static threshold uses a user-defined threshold value to evaluate rule, while Dynamic Thresholds uses machine learning algorithms to continuously learn the metric behaviour pattern and calculate the thresholds automatically.
Dynamic vs Static threshold
I have chosen static in this example and have configured the operator, Aggregation & threshold value
Sample DYNAMIC Threshold

Whenever the average percentage cpu is greater than dynamic threshold for at least 4 times in the last 20 minutes (4 aggregated points)
Next step is to configure Actions… In this we are going to add the alert action group which we created in the earlier section.
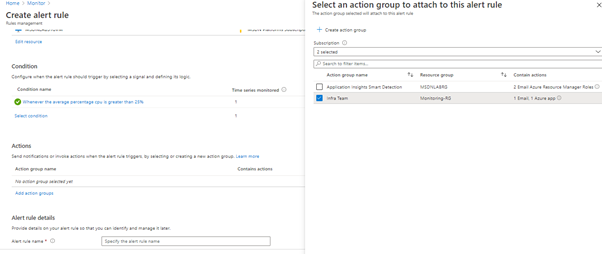

Name the alert rule, Severity and remember to enable alert.

VALIDATION
Now I have received an alert,


Hope it was useful! In the next part lets see how to create alerts with Automation runbook as Action type.
Meanwhile if you want to enable Automation runbook hybrid worker please follow the below link and enable! share your feedback and experience!
Author : Amarnath Rajendran